Network Analysis from Biological Sciences to Social Sciences: Availing Cytoscape in Ottoman Studies
- byztpz
- Sep 19, 2021
- 7 min read
Beyza TOPUZ DEMİR
University of Antwerp PhD Candidate
Network analysis is a method that is consisted of a set of techniques enabling researchers to visualize and analyze the relations among diverse actors and entities. Network analysis can be applied to various disciplines to depict relational networks and associations among variables such as a group of people, objects, geographical places, and even relationships through nodes, lines, and edges. In this respect, Cytoscape is a useful open-source software platform for network analysis and visualization. When it was initially released in July 2002, it was originally designed for biological studies but then turned into a general platform for different disciplines such as social sciences. Besides social networks and interpersonal relationships, social scientists can use Cytoscape to visualize and analyze interactions from tables, forms, and the web. With the Apps from Cytoscape App Store and other softwares such as R and NetworkX, you can experience advanced features and make sophisticated visualization and analysis. In this blog post, I will try to explain and demonstrate the main features of Cytoscape through a sample visualization of randomly selected Istanbul porters and their guarantors listed in Istanbul Court Record no.24.
Let’s have a closer look at the platform!

Source: Cytoscape website
First of all, Cytoscape is a user-friendly multilingual open-source platform that you do not even need to sign up for. Linux, Windows, and MacOS platforms can run Cytoscape. Without an official verification, other UNIX platforms might also run Cytoscape if Java version 8 is available.
By clicking “Introduction,” you can read more information on what Cytoscape is, the core features of the latest version, its desktop interface with exemplary images. Cytoscape can be downloaded in desktop and cloud. In this post, I will try to explain Cytoscape Desktop in general terms. You can find more information on Cytoscape Product Roadmap. The platform also presents detailed Cytoscape Tutorials including basic and elaborative data visualization features, exercises, protocols, and presentations. For more information on the use of version 3.8.2, you can also visit the Cytoscape 3.8.2 User Manual.
To get started, you should easily install the latest version of Cytoscape by clicking the shortcut “Download” button or you can click the “Download” tab in the second row at the top left on the home page. Java 11 will be also installed if you do not already have one. If you have a problem during the download phase, all instructions are also available on the site.
After the installation, you can launch Cytoscape now!

Source: Cytoscape website
Cytoscape supports the files written in the following formats: (i) Simple interaction file (SIF or .sif format), (ii) Nested network format (NNF or .nnf format), (iii) Graph Markup Language (GML or .gml format), (iv) XGMML (extensible graph markup and modelling language), (v) SBML, (vi) BioPAX, (vii) GraphML, (viii) Delimited text, (ix) Excel Workbook (.xls, .xlsx), (x) Cytoscape.js JSON, (xi) Cytoscape CX. Among them I used Excel (.xls, .xlsx) working sheets for my sample network study in this blog post.
Cytoscape Desktop has five panels that you can show, hide, dock, undock, minimize, and detach: Control Panel (left), Tool Panel (bottom left), Results Panel (right), Table Panel (bottom right), and Command Panel (bottom). Each panel subsumes various tabs. The Table Panel contains Node, Edge, and Network Tables while you can see the Network, Style, Filter, and Annotation tabs in the Control Panel, for instance.
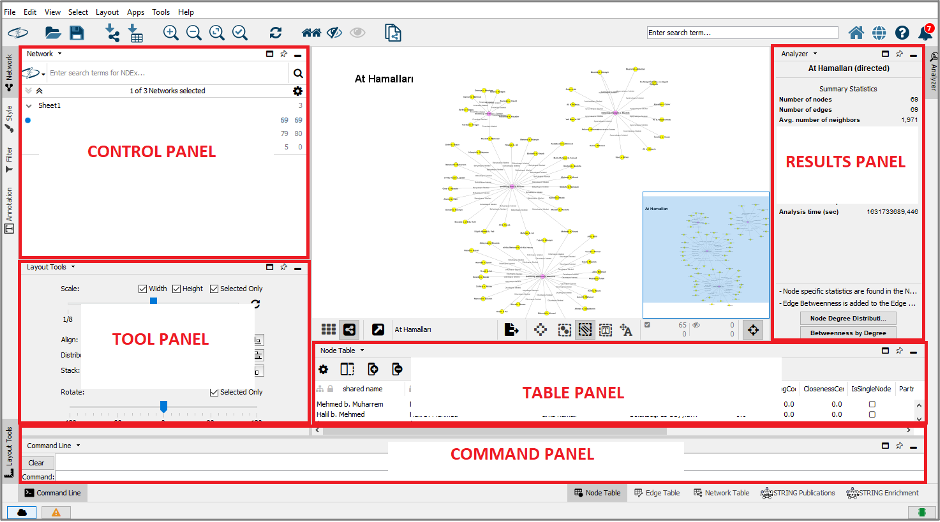
When you open Cytoscape software on your desktop, you will see the following interface.

The Tool Bar contains shortcuts for the frequently used functions which are also available in the Menus. As you keep the mouse pointer over an icon for a few seconds, a description will appear as a tooltip. Your selected nodes and edges are shown in the Table Panel, and you could modify the values of column here. Network View displays your created network and there are the following icons at just bottom of the Network View.

Show Grid
Show Network
Detach View
Export to File
Always Show Graphics Detail
Toggle Node Selection
Toggle Edge Selection
Toggle Annotation Selection
Toggle Node Label Selection
Hide Navigator (“bird’s eye view”)
If we have got a general idea about Cytoscape and a little familiarity with its desktop interface so far, let's learn how to use the software with images by going through a sample study!
You can create your own networks in Cytoscape by (i) importing fixed-format network files, (ii) importing unformatted text or Excel files, (iii) importing from public databases, (iv) adding nodes and edges manually on an empty network on Cytoscape. I preferred to import a pre-existing Excel file. To import an Excel file, you need to click “File” → “import” → “Table from File.”

You can also import your file by clicking on on the toolbar. After opening the file chooser dialog in one of these two ways, select your file from your local computer and press “Open.”

A new chooser dialog will appear immediately as you loaded your file. Now, you must decide whether you create a new network collection or load a new network into an existing network collection. Make your selection in the drop-down list.

After your load your file, click on each column header to assign the interaction parameters to the columns in the pop-up screen. You can also chance the name and data type of each column again by clicking the arrow to the right of each column header. Cytoscape supports the data types of String, Boolean (True/False), Integer, Floating Point, and List.

When you click “OK” in the right corner, your network will appear on the Network View Panel (if you specify only source column, you will have a list of nodes without edges).

Because of the default features, sometimes the whole network may not be seen. If you encounter such a situation, do not panic. To see the entire network, just activate “Fit Content” function under the “View” tab. You can also use the shortcut icons on the toolbar to zoom in and zoom out.

Cytoscape create networks by default style, but you can easily modify the style properties, node shape, label color, font size, and many other options. Click on the “Style” tab in the Control Panel and open the drop-down menu indicated by the red arrow in the image below.

Choose a new style from the drop-down list.

Still in the “Style” tab, under “Properties”, modify fill color, label font face, label font color, label position, node shape, border width, and so on. This is entirely up to your creativity and visual preferences. You can also edit the positions of nodes by dragging them on the Network View Panel manually or change the positioning of nodes and edges from the Layout Tools on the bottom-left.


You can also change node colors selectively to highlight or differentiate your data and network. For this, you can use one of two different tricky but also easy ways: either by using “Properties” or by importing “Table from File” Let’s try both!
Go to “Properties” under the “Style” tab and open the drop-down options and select which column you want to modify.

“Mapping Type” must be “Discrete Mapping”

Now, as it shown in the following image, you see the data of your selected column to modify its node colors. Click twice to the right and press the icon appeared.

Make the adjustment by selecting the colors of the nodes according to your wish from the pop-up window. After selecting the color and click “OK,” your selection will be immediately applied to the network to the right.

Coloring your nodes and edges individually enable you to highlight some subnetworks to analyze multifarious group relationships. For the following network image, I selected the “Kethüda” column that includes only two variables. This network basically shows which kethüda was the guarantor of which names from different porter groups worked in diverse regions.

It is also possible to select “names” from the “Column” and manually select nodes that you would like to modify among the entire list of names listed alphabetically.

The second way to change the color of nodes is to import a table. Create an Excel sheet. For this trial, I created the following one. Column A includes the names of the nodes of my network. The number 1 in column B represents a variable that you can type differently.

Go to “File” → “Import” → “Table from File” then select your pre-existing Excel file and click “Open.”

From the following pop-up window, select “Node Table Columns” and “shared name” and click “OK”

Because there is only one variable under the column of “Node Color Test” in my sample file, you see only one option for node coloring.

After color adjustment, my network is seen as the following. Source nodes are of one color (purple) and target nodes are of another color (orange).

You can directly search for nodes and edges through the search bar. If you type your search word with * as a wildcard character that matches zero or more characters, it is searched in entire columns. You can also search all columns by typing your word with quotation marks (“word”), but that way finds only the exactly matched ones. If you write your column title firstly then your search word with *, it searches in the indicated column. Note that the search is not case-sensitive. Let’s take a glance at the following images for a better understanding.


The color of matched nodes turns yellow and edges into red after your search. Then you can group your nodes. For this, right-click one of the selected (yellow) nodes and select “Group” → “Group Selected Nodes”

Now, you can see the grouping of nodes named “Mustafa”

The “Filter” tab in the Control Panel allows you to filter nodes and edges and create a subnetwork by your selection. Three different filter options are available as “Column Filter,” “Degree Filter,” and “Topology Filter.” Selected nodes again turn yellow in all filter options.

Based on the column data type, “Column Filter” provides different alternatives to match nodes and edges with specific column values. For the string data type, it has five options:
contains: means to select values that contain the text
doesn’t contain: means to select values that do not contain the text
is: means to select the exactly matched values with the text
is not: means to select exactly unmatched values with the text
regex: means to select matched values with a regular expression (for elaborated filtering)

“Degree Filter” enable to display the networks that have the determined number of connections.

“Topology Filter” serves to filter nodes that have a determined number of neighbors within a certain distance and have a sub-filter.

If you want to create a new network depending on your filter, go to “File” → “New Network” → “From Selected Nodes, All Edges”

You can also add image, shape, and text annotations to your network. For this, click right on an empty area on the Network View and hold your mouse pointer over “Add” for a few seconds to see the options.


Although Cytoscape has many features and tools, lastly, I will show you how to export your files in this blog post. You can export your results as:
Network to NDEx,
Collection to NDEx,
Network to File,
Network to Image
Network to Web Page
Table to File,
Styles to File
Let’s see how you can save your networks as an image in JPEG (*.jpeg, *.jpg), PDF (*.pdf), PNG (*.png), PostScript (*.ps), and SVG (*.svg) formats.
Go to “File” → “Export” → “Network to Image” Then select the format type and click “OK”
You can also use the export shortcut located in the Tool Bar.

For a better quality of your image in JPEG or PNG formats, please adjust the parameters in the following window that automatically appears after you click “OK”


Comments